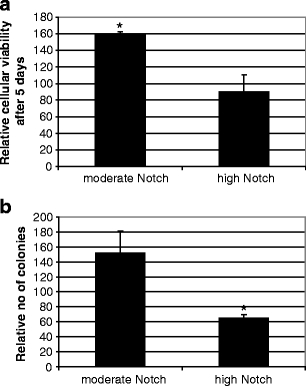
Fig. 2.

Functional effects of moderate and high Notch overexpression in SiHa cells. a Cellular viability measured by MTT assay. The Y-axis indicates the relative cellular viability following 5 days in culture. Control transfections were set to 100% b Quantification of anchorage independent growth, in which the number of colonies was counted after 3 weeks in culture. Control transfections were set to 100%. (*) Indicates significant differences compared to control transfections
