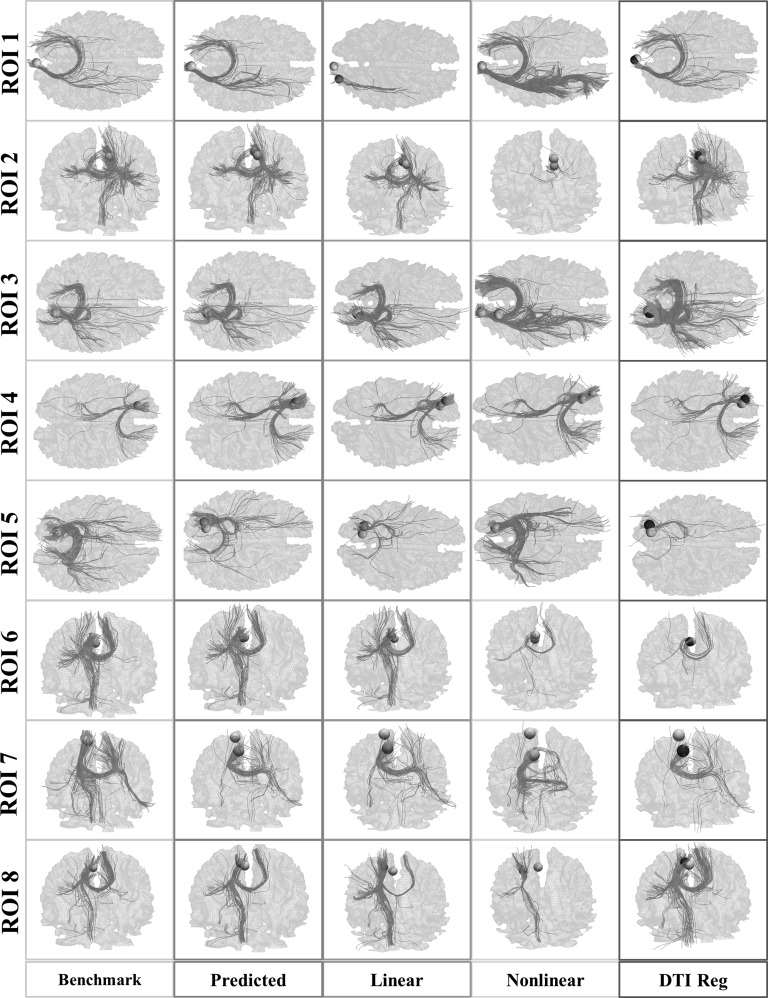
Figure 11.
Visualization of fiber bundles emanating from predicted ROIs using FSL FLIRT (purple column), HAMMER (light blue column), and DTI Reg (dark blue column) methods. Our prediction (green column) and the benchmark bundles (yellow column), which are the same as columns 4 and 5 in Figure 6, are also shown in the left most columns for comparison. Yellow bubbles: benchmark ROIs; Green bubbles: predicted ROIs via our method; Light blue bubbles: predicted ROIs by HAMMER; purple bubbles: predicted ROIs by FLIRT; dark blue bubbles: predicted ROIs by DTI Reg.

