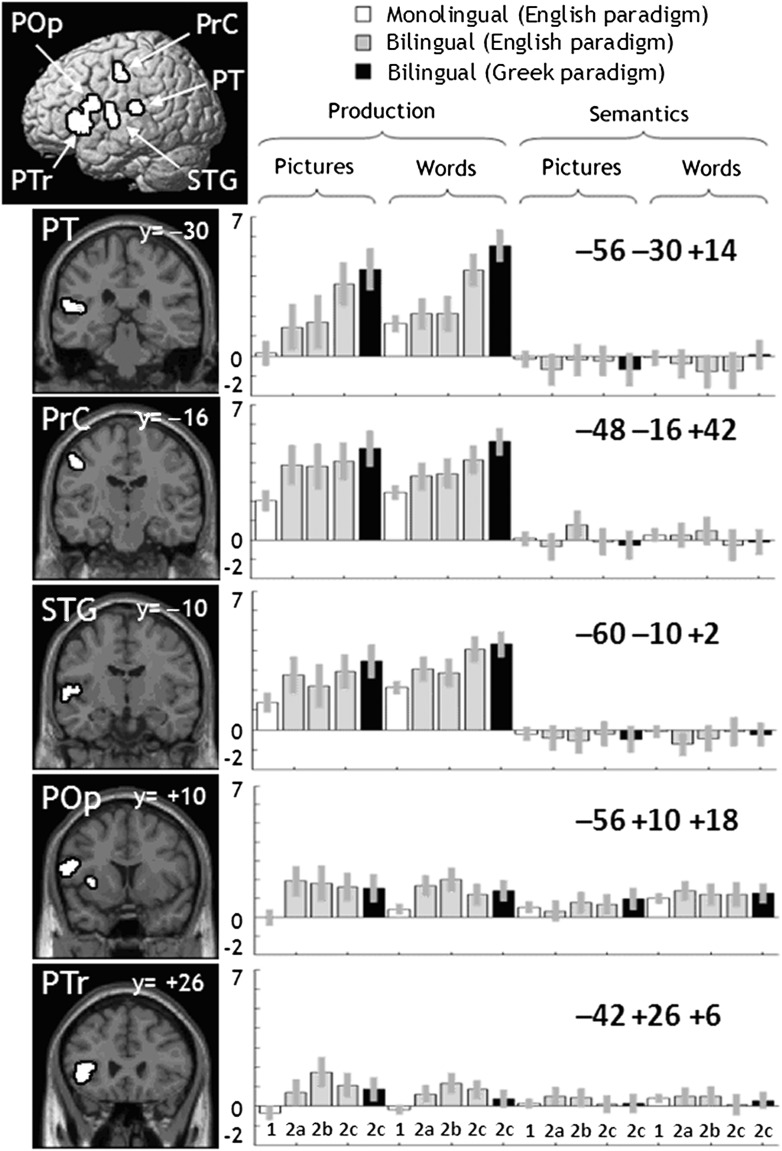
Figure 3.
Main effect of Bilingualism. This is a visualization of Table 3. A sagittal rendering and coronal sections are given on the left. F-maps are on the right, with groups and conditions along the x-axis, and values along the y-axis (within the range [−2, 7]). Conditions are arranged into tasks (naming pictures, reading words aloud, matching semantically related pictures, matching alphabetic strings). Conditions are also colored white for monolinguals, gray for bilinguals in the English paradigm, and black for bilinguals in the Greek paradigm.

