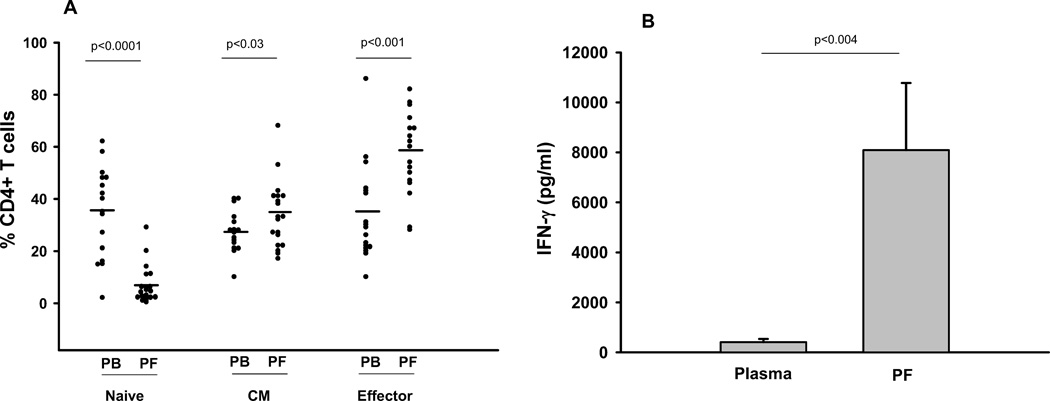
Fig. 2. Cellular analysis of pleural fluid and blood from Moroccan cohort.
A. Percent CD4+ cells in the three subsets of naïve, central memory, and effector phenotype for PBMC and PFMC are depicted. The line represents the median of 19 subjects. B. IFN-gamma in plasma and pleural fluid is determined by ELISA. Means from 9 subjects are shown and error bars represent standard deviations. Wilcoxon Matched-Pairs Signed-Ranks Test was used to calculate statistics in both panels.

