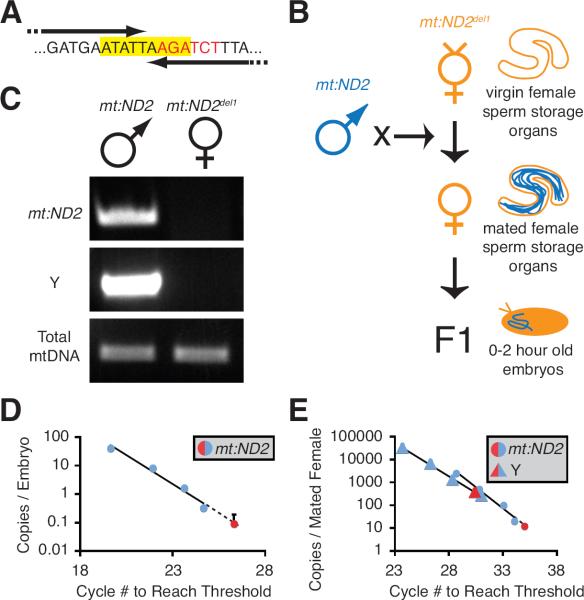
Figure 1. Paternal mtDNA is Excluded from Mature Sperm and Fertilized Embryos.
(A) Sequence of nucleotides deleted in mt:ND2del1 (yellow highlight), and the BgIII restriction site (red font) that was targeted in the generation of mt:ND2del1. Arrows show the 3' portion of PCR primers that anneal to wild type (mt:ND2), but not mutant (mt:ND2del1) mtDNA. (B) Cross scheme and experimental design. (C) PCR genotyping of parental lines that were crossed to follow wild type paternal mtDNA in (D,E). (D) qPCR measuring paternal mtDNA (mt:ND2) transferred to deletion mutant eggs (mt:ND2del1). The mean paternal mtDNA copy number (red dot) in relation to a standard curve (blue dots) is graphed on a “per embryo” basis. Error bar represents standard deviation in three embyro extracts. (E) qPCR measuring the amount of mtDNA (mt:ND2) in sperm stored by mt:ND2del1 females. Y chromosome (red a triangle) and sperm mtDNA (red circle) copy number in representative sperm storage organ extract in relation to standard curves (blue) are graphed on a “per female” basis. In (D,E), standard curves were generated by adding 100 to 12500 copies of mt:ND2 (blue circles) or Y chromosomal DNA (blue triangles) to control extracts, and graphed on a “per embryo” or “per female” basis. See also Fig. S1.

