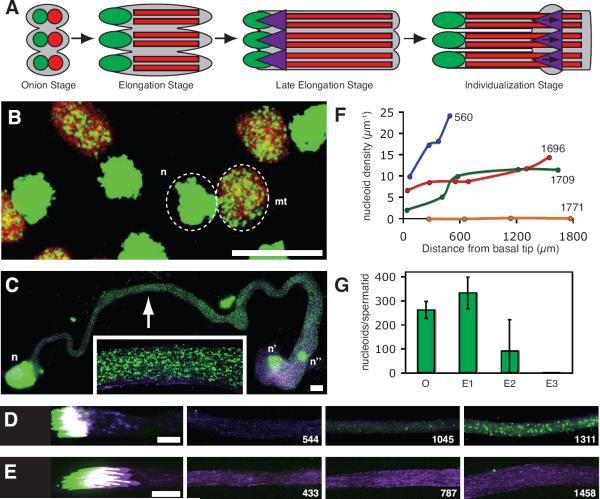
Figure 2. mtDNA Nucleoids Disappear During Spermatogenesis.
(A) Schematic summary of post-meiotic sperm development depicting nuclei (green), mitochondria (red), and investment cones (purple). (B) Onion stage spermatids stained for DNA (PicoGreen: green), and mitochondria (mito-YFP: red). Each nucleus (n) is paired with a large mitochondrial structure, the nebenkern (mt). (C–E) Elongating spermatid bundles stained for DNA (PicoGreen: green) and actin (phalloidin: purple). (C) Elongation R stage bundle, 560 μm long. A cluster of normal spermatid nuclei (n), apically discarded spermatid nuclei (n'), and a somatic cell nucleus belonging to a cyst cell (n”) form large staining foci. mtDNA nucleoids (magnified in inset) form much smaller foci throughout the tail bundle. (D,E) Two late elongation stage bundles, 1729 μm (D) and 1747 μm (E) long. Numbers indicate distance (μm) of image from basal tip of bundle. Scale bars are 10 μm. (F) Nucleoid density (number of nucleoids/μm) along the lengths of 4 representative spermatid bundles (each bundle is a different colored line) of the indicated length (μm). (G) Average number of nucleoids per onion stage spermatid (O), elongating spermatid < 1700 μm (E1), elongating spermatid 1700–1800 μm (E2), and elongating spermatid > 1800 μm (E3). Error bars indicate standard deviation in a least 3 cysts. See also Fig. S2.

