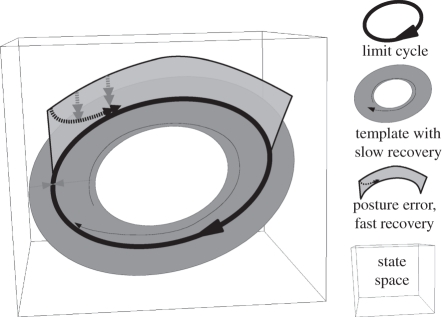
Figure 2.
Slow–fast dynamics as a template. The periodic limit cycle is shown as a thick dark loop with an arrow. The template (a slow manifold) is shown as a grey oval band representing a family of trajectories and is the target for all perturbed states. Perturbations (shown by a light grey vertical wall perpendicular to the template band) that generate states that are not part of the template manifold collapse quickly (double arrows, dashed line) to the template. Perturbations that generate valid template states (are on a slow manifold) collapse back to the cycle much more slowly (thin spiral arrow on oval template band).

