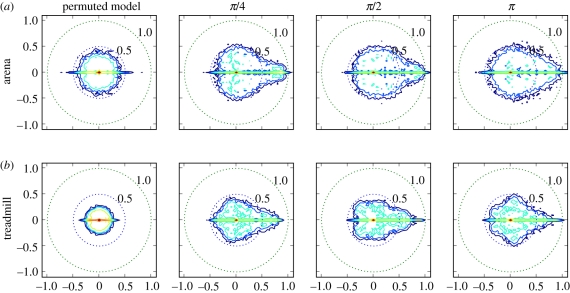
Figure 5.
Eigenvalue visualizations for experimentally derived distributions of return map matrices  at phases ϕ = π/4, π/2, π (columns 2,3,4), from two datasets (rows; §2). The visualization shows probability contours for the distribution of eigenvalues obtained from the matrices produced by algorithm 1 step 9; if all matrices generated were identical, the distribution would consist of 27 delta functions. The leftmost column shows eigenvalues for surrogate based control
  S [ϕ] (see §3.8.1 for details). While these controls seem similar to a circular law distribution, map data show distinct structures with large real eigenvalues. Despite some superficial similarities, the eigenvalue distributions at different phases are clearly distinct. (Online version in colour.)

