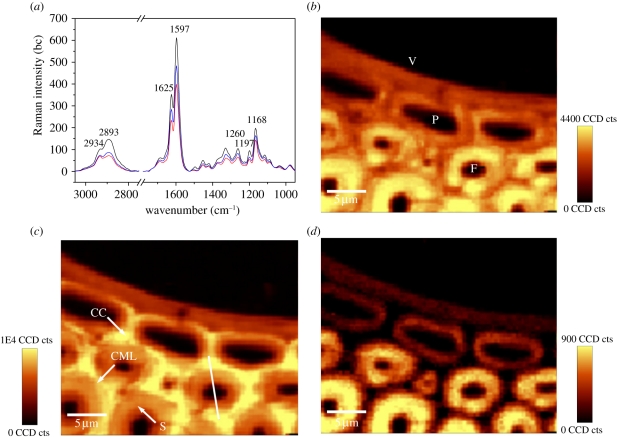
Figure 2.
(a) Baseline corrected average Raman spectra of the secondary wall of the fibre (F, black line), metaxylem vessel (V, red line) and parenchyma cell (P, blue line) from the vascular bundle of P. pubescens. (b) Raman images of the metaxylem vessel (V), parenchyma cells (P) and the surrounding fibres (F) calculated by integrating from 2789 to 3036 cm−1 (all components). (c) Raman images integrating from 1517–1751 cm−1 (lignin coupled with phenolic acids). (d) 2793–2919 cm−1 (accentuating cellulose oriented in fibre direction).

