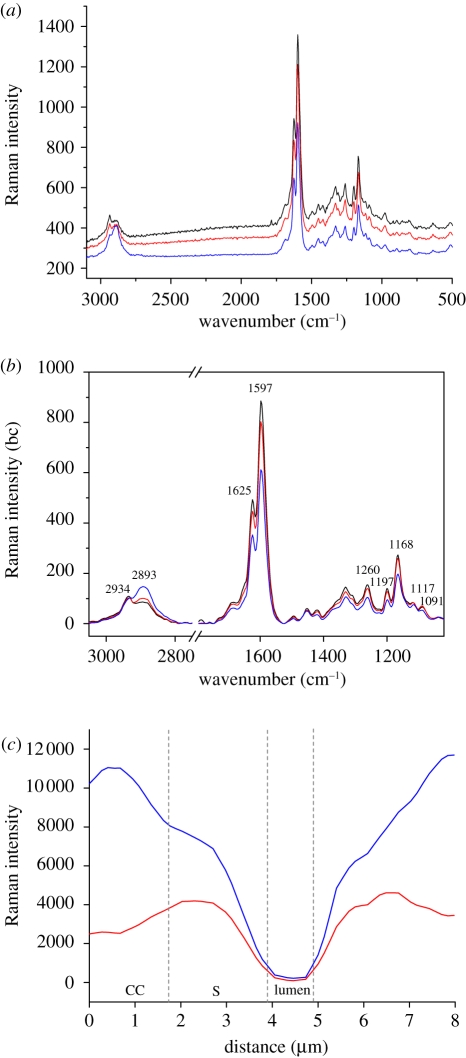
Figure 3.
(a) Average Raman spectra of the cell corner (CC, black line), compound middle lamella (CML, red line) and the secondary wall of the fibre (S, blue line). (b) Baseline corrected (bc) spectra zoomed into the prominent bands. (c) Intensity distribution of lignin coupled with phenolic acids (1517–1751 cm−1; blue curve) as well as all components (2789–3036 cm−1; red curve) across the cell wall (line marked in figure 2c) of a thick-walled bamboo fibre.

