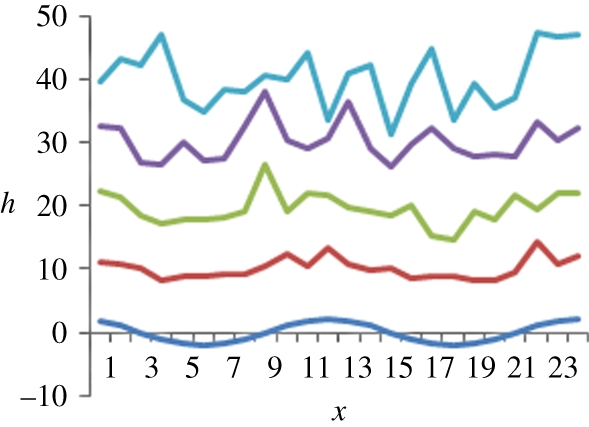
Figure 5.

Simulated profiles at different times for solutions of the RD equation for which the initial condition is a small-amplitude sinusoidal profile. Here F = 10 and D = 1. Snapshots correspond to times: dark blue, t = 0; red, t = 1; green, t = 2; purple, t = 3; light blue, t = 4.
