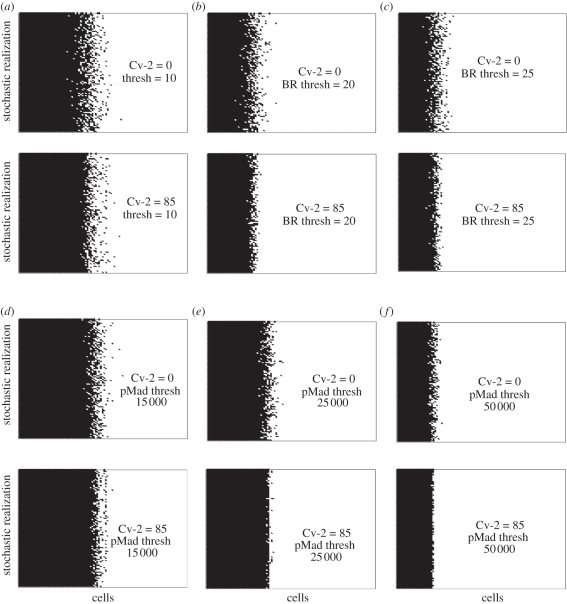
Figure 6.
Spatial variation for (a–c) BR and (d–f) pMad: (a–c) Noisy interpretation of BR in the absence (top) and presence (bottom) of Cv-2 for thresholds for 10, 20, 25 molecules per cell. Black points are above threshold, white points are below. (d–f) Plots are obtained as mentioned for figure (a–c) except for pMad with thresholds of 15 000, 25 000, 50 000 molecules per cell.

