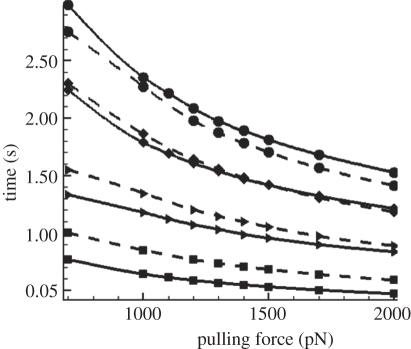
Figure 6.
Rupture time of BFP-manipulated cell detachment versus loading force at four different decohesion stages: catch bond model is denoted by solid lines, while slip bond model is denoted by dashed lines. Lines with squares denote time for 10% bonds broken, lines with triangles denote time for 30% bonds broken and lines with diamonds denote time for 60% bonds broken; lines with circles denote lifetime.

