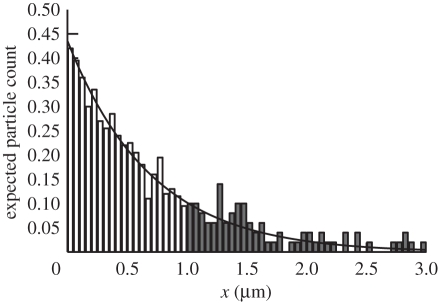
Figure 5.
The TRM applied to the morphogen gradient model that was introduced in §2.3. Plot of the expected morphogen molecule count per compartment evaluated at t = 3 s according to (2.8) (black line) and 200 realizations of the TRM simulation (compartment molecule probability density shown in white compartment bars and free molecules counted into compartments and shown in dark bars).

