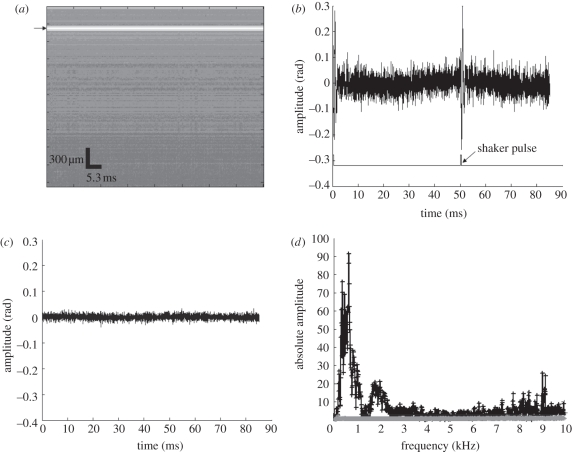
Figure 2.
(a) Amplitude data of M-mode PhS-OCT image at the detection point (black arrow points the surface data selected to analyse the phase change), (b) phase change of the surface wave signal and waveform of the shaker pulses on a 1% agar phantom, (c) phase change of the detected system noise and (d) frequency contribution of the system noise (c) and the detected surface wave signal (b). (d) Asterisks with solid line, frequency contribution of system noise; vertical bars with solid line, frequency contribution of typical surface wave signal.

