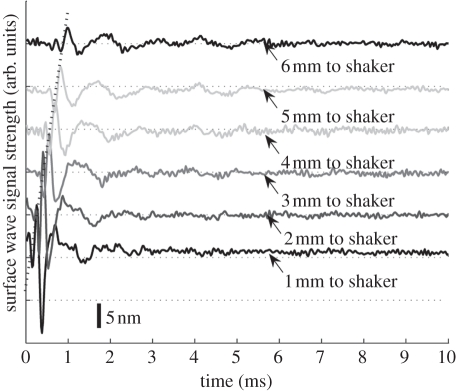
Figure 3.
Surface wave signals of a single layer 2% phantom at a distance of 1 mm (bottom) to 6 mm (top) from the shaker head, with 1 mm per step. Each surface wave signal is purposely shifted vertically by equal distance in order to better illustrate the results captured from different positions. The bar indicates the estimated displacement of the surface wave. The same also applies to figures 6, 8 and 9. The horizontal dotted lines indicate the baseline.

