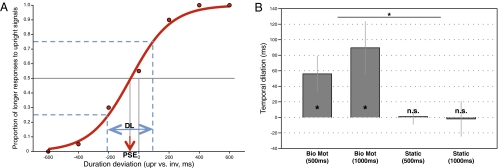
Fig. 2.
(A) Psychometric function for a typical observer in biological motion condition with a standard duration of 1,000 ms. The graph shows the proportion of the “longer” responses to the upright stimuli as a function of the differences between the presentation durations of the two test stimuli (upright vs. inverted). The red arrow indicates the PSE and the blue arrows indicate the DL. (B) Duration discrimination results from experiment 1. The temporal dilation effect (i.e., minus PSE) of the biological motion stimuli was significantly larger than that of the static figures (*P < 0.05; n.s., not significant). Error bars show standard errors.

