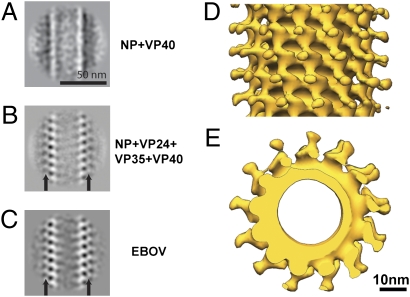
Fig. 5.
Location of viral proteins in the EBOV NC. (A) 2D class averages of the NC from NP+VP40 VLPs. (B) 2D class averages of the NC from NP+VP24+VP35+VP40 VLPs. (C) 2D class averages of the NC from EBOV virions. Black arrows indicate protrusions. (D) Subtomogram averaging reconstruction of the NC helix from NP+VP24+VP35+VP40 VLPs. Isosurfaces have been contoured at 1.5 σ away from the mean, and the helical axis is vertical in the plane of the paper. (E) The same reconstruction viewed along the helical axis.

