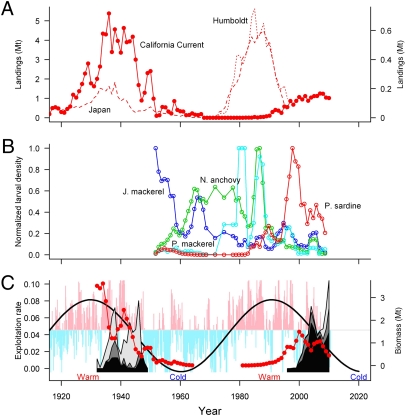
Fig. 2.
(A) Landings in Mt of the sardine fisheries off the west coasts of North America (solid line, right y-axis), Chile (dotted line, left y-axis), and Japan (dashed line, left y-axis) (12). (B) Normalized 3-y-running mean larval densities of northern anchovies (green line), Pacific sardine (red line), Pacific mackerel (aqua line), and jack mackerel (blue line) off southern California indicate changes in the dominant pelagic fish species in the CCE: sardine in 1990–2010, jack mackerel in the 1950s, anchovy in the 1960s–1980s, and Pacific mackerel in the 1980s. (C) Biomass of the northern sardine stock age 2 y+ in the CCE (25) (red); cumulative exploitation rates (catch divided by estimated abundance) from the fisheries off Oregon (black), Washington (dark gray), and Vancouver Island (light gray); and monthly PDO indices (vertical blue and pink bars) oscillating with a 60-y period; Our fit of a 60-y cycle to the monthly PDO index (black line) predicts the indices will be maximally negative in 2020 and suggests another warm period conducive to sardine in 2035. The dramatic drop in the exploitation rate of the northern fisheries in the 1940s is the result of the decline and interruption of the feeding migration that occurred 5 y after the landings peaked in the northern fisheries. In 2010, the exploitation rate in the northern fisheries peaked at a new maximum. The time series of sardine landings used to construct A were obtained from refs. 12 and 25. The time series of larval densities of northern anchovies, Pacific sardine, Pacific mackerel, and jack mackerel in B are from the 1951–2010 CalCOFI surveys (http://calcofi.org).

