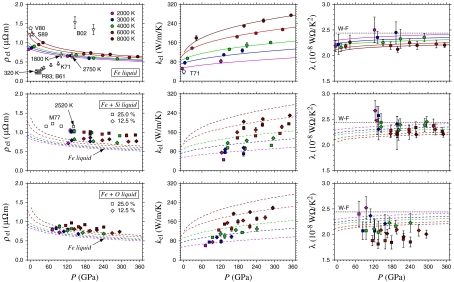
Fig. 1.
Computed electrical resistivity (ρel), thermal conductivity (kel), and corresponding Lorenz numbers (λ). Solid lines (top row) and dashed lines (middle and bottom rows) show the Bloch–Grüneisen models of Fe liquid; the horizontal dotted line indicates the value of the Lorenz number expected via the Wiedemann–Franz relation (W-F). Hugoniot temperatures (25) for selected shock compression datapoints [K71 (10), M77 (12), B02 (11)] are shown to guide comparisons. Other experimental data (see text): R83 (17), B61 (18), T71 (28), S89 (27), V80 (26).

