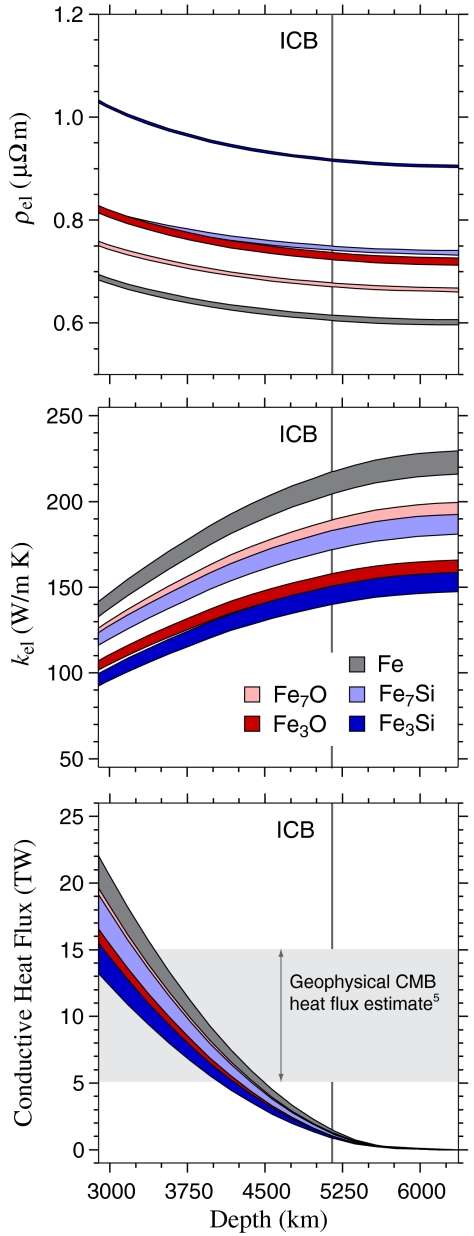
Fig. 3.
(Top) Electrical resistivity and (Middle) electronic thermal conductivity for the various compositions considered in this study, evaluated using the models in Table 1 along a range of candidate core adiabats (see text). (Bottom) Corresponding heat flux values computed as 4πr2kel∇T, where r is the radius, compared to geophysical estimates of core–mantle boundary (CMB) heatflux (5).

