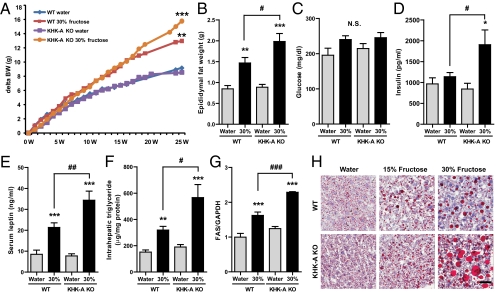
Fig. 3.
Effect of high fructose consumption in WT mice and KHK-A KO mice. WT mice and KHK-A KO mice given ad libitum normal chow diet with 15 or 30% fructose water or tap water for 25 wk (n = 8–9). Serum and tissue samples were collected after 6 h fasting. (A) Growth curves of WT mice and KHK-A KO mice. (B–E) Epididymal fat weight (B), serum glucose (C), serum insulin (D), and serum leptin (E) (n = 9). (F) Intrahepatic triglyceride levels (n = 7). (G) Western blot analysis of FAS. Relative intensity of FAS to GAPDH in liver (n = 4). (H) Representative images of Oil Red O staining in WT mice and KHK-A KO. (Scale bar, 50 μm.) Data represent means ± SEM *P < 0.05, **P < 0.01, ***P < 0.001 vs. respective water control. #P < 0.05, ##P < 0.01, ###P < 0.001. NS, not significant.

