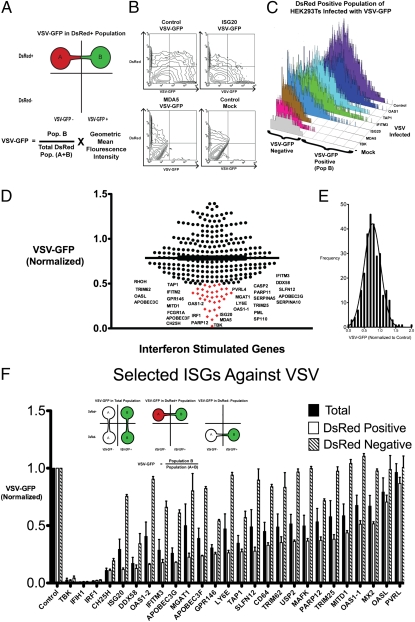
Fig. 2.
(A) Schematic of FACS-based assay to identify ISGs against VSV-GFP. HEK293T cells were transfected with individual ISGs with DsRed plasmid at a 3:1 ratio. DsRed-positive cells indicate cells that highly express the ISG. VSV growth (VSV-GFP) was calculated by the product of the percent GFP-positive cells and the geometric mean fluorescence intensity (MFI) of GFP in the DsRed-positive cells. (B) Contour maps of VSV-GFP in HEK293T cells transfected with the indicated ISGs and DsRed. (C) VSV-GFP was measured in the DsRed-positive population of selected ISGs transfected in HEK293T cells. TBK-1 was used as a positive control. (D) All 288 ISGs were screened by a FACS-based method. Each dot represents an ISG, and its effect on VSV-GFP expression is normalized to VSV-GFP in control transfected cells. ISGs that inhibited VSV-GFP expression over 50% are labeled and indicated in red. Values represent mean of duplicates. (E) Histogram of all ISGs and their effect on VSV-GFP normalized to VSV-GFP in control transfected cells. (F) Effect of individual ISGs on VSV-GFP expression in total population, DsRed-positive population, and DsRed-negative population was calculated. Values represent mean ± SEM from biological triplicates.

