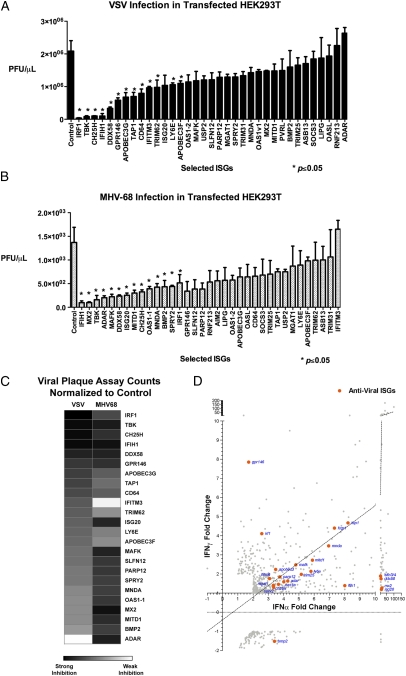
Fig. 4.
(A and B) The inhibitory effects of 34 ISGs selected from previous screens against VSV (A) and MHV-68 (B) were measured by plaque assay. Values represent mean ± SEM. Data represent 1 of 3 experiments. Asterisks indicate significant difference compared with control by Student's t test (P < 0.05). (C) Heat map showing the inhibitory effect of selected ISGs on VSV and MHV-68 based on plaque assay. (D) Antiviral ISGs (orange) was graphed with respect to their fold induction by IFNα and IFNγ in microarray analyses (Fig. 1).

