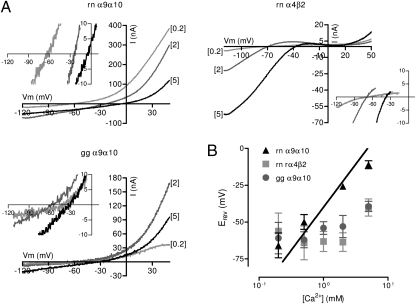
Fig. 2.
Chicken recombinant α9α10 nAChR has lower relative calcium permeability. (A) Representative I-V curves obtained on application of voltage ramps (−120 to +50 mV, 2 s) at the plateau of the response to 10 μM (α9α10) or 100 μM (α4β2) ACh in oocytes superfused with N-methyl glucamine–based solutions containing different Ca2+ concentrations for oocytes expressing rat α9α10 (Upper Left), rat α4β2 (Upper Right), or chicken α9α10 nAChRs (Lower Left). (Insets) Magnification near the Erev. (B) Plots of Erev values as a function of Ca2+ concentration for rat α9α10, rat α4β2, and chicken α9α10 nAChRs. Values are mean ± SEM of n = 5–8 per point.

