Fig. 5.
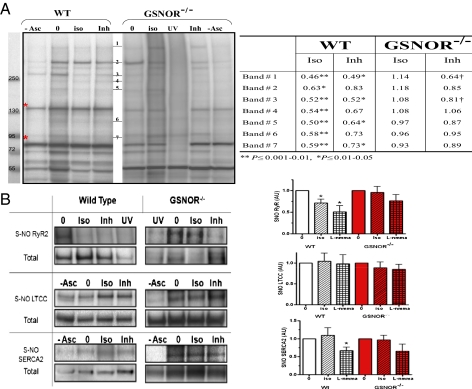
Effect of ISO and NOS on S-nitrosylation of proteins in the heart and cardiomyocytes. (A) S-nitrosylated protein band clusters in WT and GSNOR−/− mice heart homogenates by Western blot analysis. Each lane represents biotin-switched homogenate of a whole heart perfused with Krebs–Henseleit solution (0), in the presence of 2.5 nM ISO (iso) or the NOS inhibitor (Inh) l-NMMA (100 μM). Elimination of sodium ascorbate (−Asc) or exposure to UV-photolysis (UV) are controls for the biotin-switch technique (30). Red asterisks indicate endogenously biotinylated proteins. The table shows densitometric quantification of SNO protein band clusters normalized to baseline (0). ISO and l-NMMA reduced S-nitrosylation levels in WT whereas this effect is blocked or attenuated in GSNOR−/− mice (*P ≤ 0.01–0.05 and †P ≤ 0.001–0.01; ANOVA with Student Newman–Keuls post hoc test; WT 0 and ISO, n = 11; l-NMMA, n = 5; GSNOR−/− 0 and ISO, n = 9; l-NMMA, n = 3). (B) Representative Western blot images of immunoprecipitated SNO-RyR2, LTCC, and SERCA2 after biotin-switch assay, with cumulative measurements displayed graphically. Each graph shows the effect of ISO and l-NMMA on SNO levels of RyR2, LTCC, and SERCA2 in WT and GSNOR−/− mice hearts. The SNO level was detected by anti-biotin antibody normalized to the total protein load as detected with its specific antibody (*P ≤ 0.01–0.05; ANOVA with Student Newman–Keuls or Kruskal–Wallis posttest). Western blot images are representative of n = 4–6 RyR2, n = 7–9 LTCC, and n = 4–6 SERCA2. In the GSNOR−/− heart, ISO-induced denitrosylation of RyR2 was substantially abrogated.

