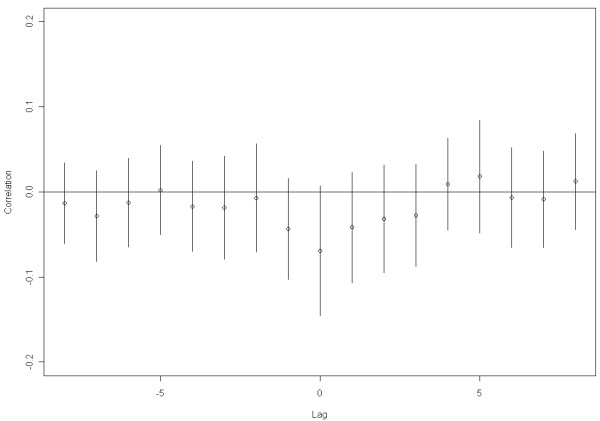
Figure 5.

Average Pearson correlation coefficients with 95% confidence intervals (CI) between hours of leisure time physical activity and low back pain intensity over the 52 weeks for cleaners answering more than 80% of the text messages (n = 49). When time lag (week) = 0, the correlation coefficient is between leisure time physical activity and low back pain reported in the same week (e.g. leisure time physical activity in Week 3 vs. low back pain intensity in Week 3). Lag = -1 when leisure time physical activity is correlated with low back pain intensity in the previous week (e.g. leisure time physical activity Week 3 vs. low back pain intensity Week 2).). Lag = +1 when leisure time physical activity is correlated with low back pain intensity in the following week (e.g. leisure time physical activity Week 3 vs. low back pain intensity Week 4).
