Figure 4.

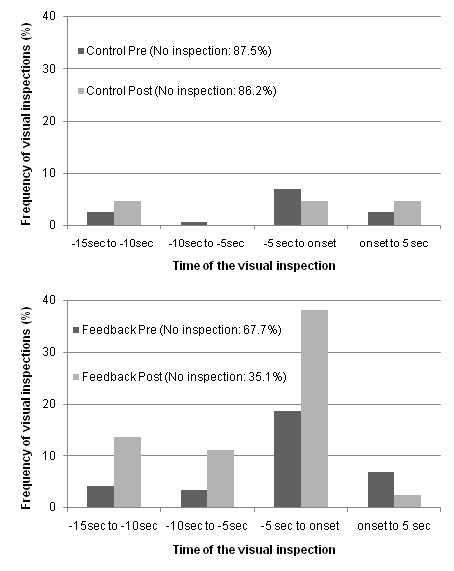
Frequency distribution (%) of the temporal occurrence of the first inspection toward the blind spot. The top panel is for the Control group and the bottom panel for the Feedback group.

Frequency distribution (%) of the temporal occurrence of the first inspection toward the blind spot. The top panel is for the Control group and the bottom panel for the Feedback group.