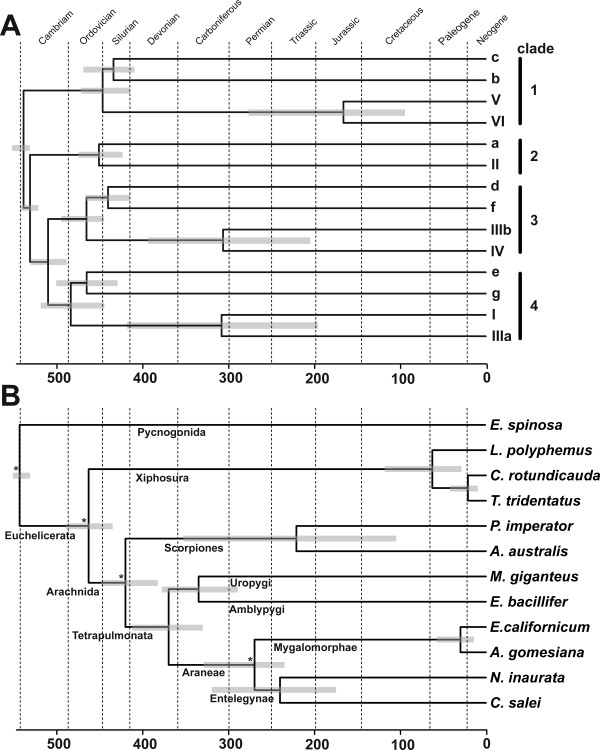
Figure 2.
Timescale of hemocyanin evolution. A. Evolution in the chelicerate hemocyanin subunits. B. Hemocyanin-derived timescale of chelicerate evolution. The divergence times are means resulting from the estimates obtained with a birth-death process and soft bounds. Rates across sites were modeled assuming a gamma distribution. The grey bars correspond to the 95% confidence intervals. Ma, million years ago; asterisks denote the nodes used for calibration (see Table 1).

