Figure 3.

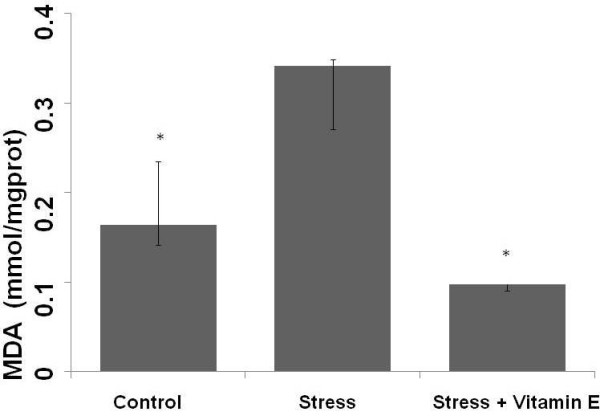
Concentrations of renal malondialdehyde (MDA) in control (Control), exercise stress (Stress) and exercise stress treated (Stress + Vitamin E) groups. *p < 0.0001: Different from Stress group.

Concentrations of renal malondialdehyde (MDA) in control (Control), exercise stress (Stress) and exercise stress treated (Stress + Vitamin E) groups. *p < 0.0001: Different from Stress group.