
Figure 3.
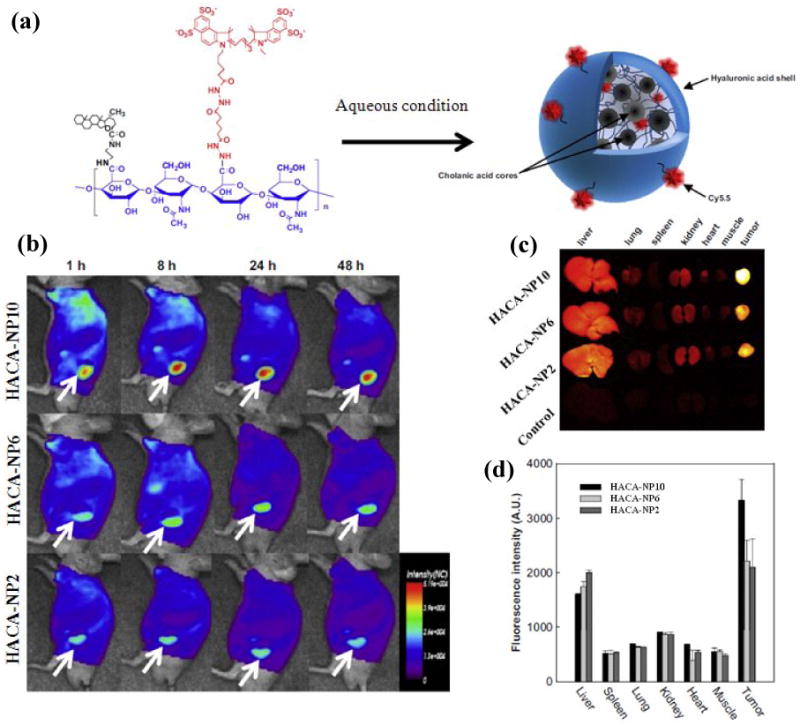
(a) Structure of Cy5.5-labeled HACA-NPs in aqueous solution; (b) Time dependent whole body images of athymic nude mice, after intravenous administration of HACA-NPs (where 2, 6 and 10 represents the number of cholanic acid moeites per 100 sugar residue of HA); (c) Representative Ex vivo fluorescence images of dissected organs and tumor; and (d) Quantified ex vivo characteristics of HACA-NPs. (Adapted with permission from Choi et al. [143]).