
Fig. 3.
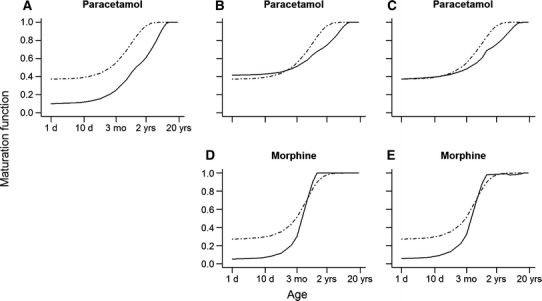
Comparison of the AS maturation functions with the maturation functions of different subset of enzymes activities involved in the metabolism of paracetamol (a, b and c) and morphine (d and e) as applied by the PBPK models. The black dot-dashed lines represent the AS maturation functions and the black solid lines represent the maturation function as applied in the PBPK models. In a, the black solid line represents the enzyme activities of UGT1A6 only; in b, the black solid line represents the combined enzyme activity of UGT1A6 and sulfation in a ratio of 65 to 35; in c, the black solid line represents the combined activity of all enzymes/routes including CYP2E1 and renal clearance; in d, the black solid line represents the enzyme activities of UGT2B7 only; and in e, the black solid line represents the combined activity of all enzymes/routes including CYP3A4 and renal clearance