
Fig. 4.
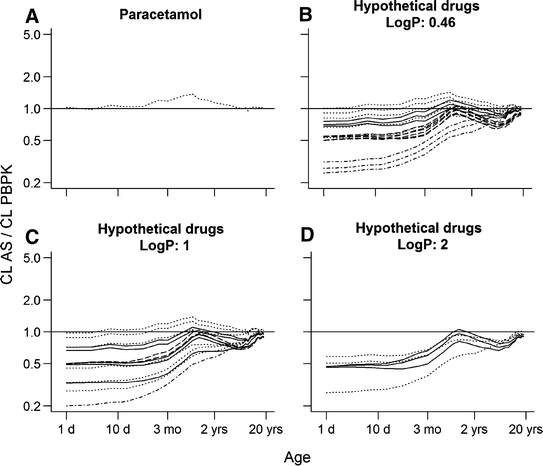
Ratio of clearance predictions using AS in combination with maturation function to clearance predictions using PBPK models (to be used as reference for the simulations using the hypothetical drugs). a represents the ratio of estimated clearance for paracetamol to predicted clearance by PBPK. The remaining represent the ratios for the hypothetical drugs with log P equal to 0.46 (b), 1 (c) and 2 (d). Each line represents one hypothetical drug: dot-dashed black lines represent drugs with very low extraction ratio (<0.05); dotted black lines represent drugs with low extraction ratio (0.05–0.3); solid black lines represent drugs with intermediate extraction ratio (0.3–0.7); and dashed black lines represent drugs with high extraction ratio (>0.7)