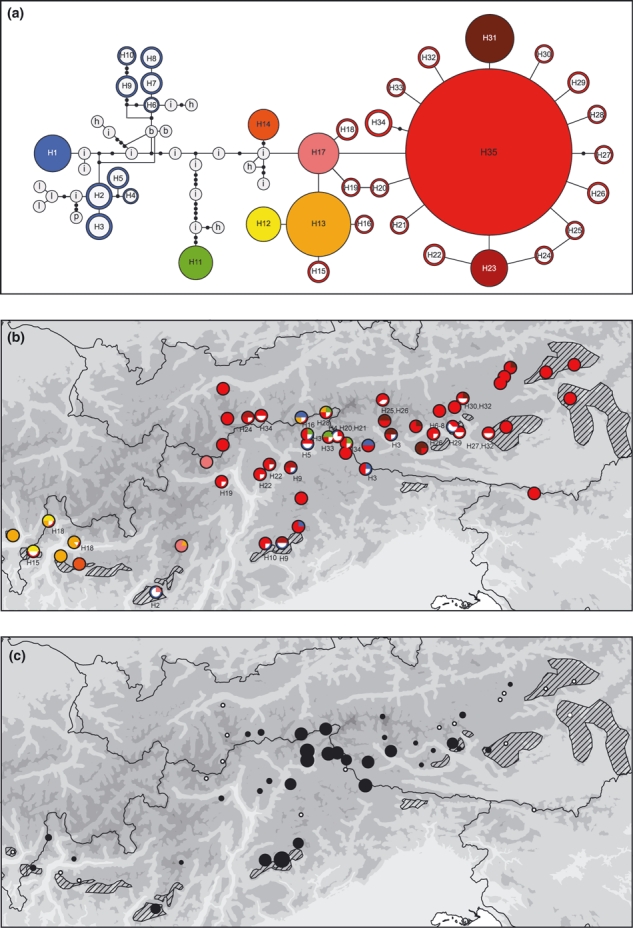
Fig. 2.

Patterns of plastid DNA variation in diploid Senecio carniolicus. (a) Statistical parsimony network of plastid haplotypes (blue, green and yellow to red colours correspond to haplotype groups 1, 2 and 3, respectively, identified by beast), a circle’s size being proportional to the square-root transformed frequency of the respective haplotype; haplotypes found in other species of the Incani clade are indicated by grey circles (b, S. boissieri; h, S. halleri; i, S. incanus; l, S. leucophyllus; p, S. persoonii) without indication of these haplotypes’ frequencies; unsampled haplotypes are represented by black dots. (b) Geographic distribution of plastid haplotypes; colours as in (a), haplotypes occurring in fewer than four individuals are marked with their number. (c) Within-population plastid haplotype diversity calculated as the mean number of pairwise differences (π), its magnitude being proportional to dot size (invariable populations indicated as white dots). Hatched areas in (b) and (c) as in Fig. 1.
