
Fig. 2.
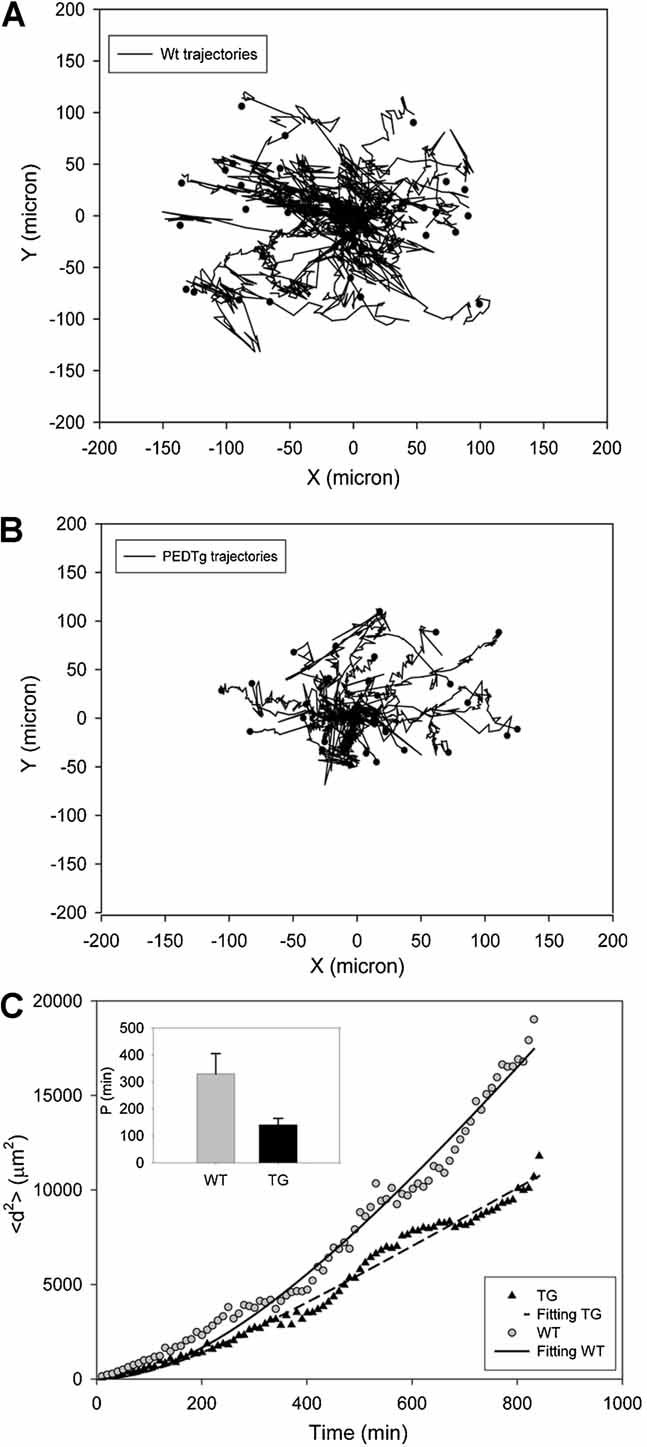
Fibroblast trajectory analysis and mean square displacements. A direct analysis of cell trajectories is used to characterize the motion of Wt (A) and TgPED fibroblasts (B). The trajectory of each cell is represented by the sequence of the cell center of mass positions translated to start from the same origin. To quantitatively assess cell movement, the mean square displacements (C) are calculated for a population of 40 cells tracked for 16 h using a semiautomated Cell Tracking software as described in “Materials and methods” Section. The inset in (C) reports the different persistence time calculated for the WT and TgPED.