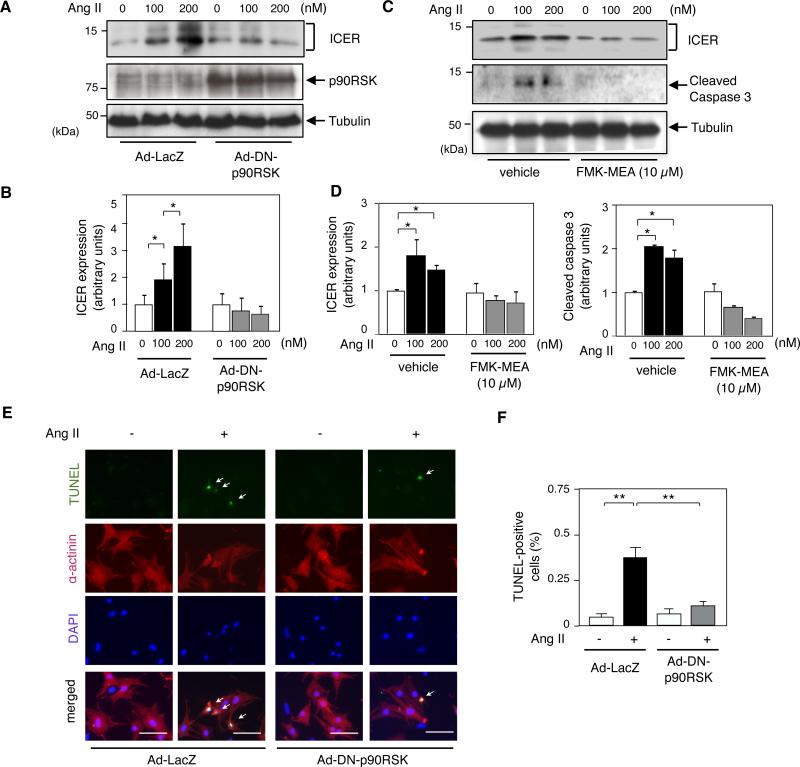
Figure 1. Ang II induced ICER expression and apoptosis via p90RSK activation.
(A) Cardiomyocytes were transduced with adenovirus containing either dominant negative form of p90RSK (Ad-DN-p90RSK) or LacZ (Ad-LacZ) as a control (MOI = 20) for 3 h. They were then stimulated with Ang II (100 nM and 200 nM) for 24 h. ICER, p90RSK and tubulin were detected by Western blotting with each specific antibody. (B) ICER band intensities were quantified (Fujifilm Image Gauge 4.0) and normalized relatively to tubulin band intensity. Results are expressed as fold increase in Ang II-treated compared to the untreated group. * p<0.05, compared to untreated control, mean±S.D., n=3. (C) Cardiomyocytes were stimulated with Ang II for 24 h after 3 h of FMK-MEA pre-treatment, and Western blotting was performed with each specific antibody. (D) ICER and cleaved caspase-3 band intensities are shown relatively to the tubulin band intensity at each point. Shown is mean±S.D. (n=3). *p<0.05 , compared to the vehicle control. (E) Cardiomyocytes were transduced with Ad-DN-p90RSK or Ad-LacZ as in (A) and stimulated with AngII (200 nM) for 24 h, and processed for TUNEL staining. Representative pictures of TUNEL (top),α-actinin (second row), DAPI (third row), and merged (bottom) staining. 40X objective lens. Scale bars: 40 μm. (F) Bar graphs showing percentage of TUNEL positive cells (total of 400-600 cells counted). **p<0.01, *p<0.05, mean±S.D., n=3.

