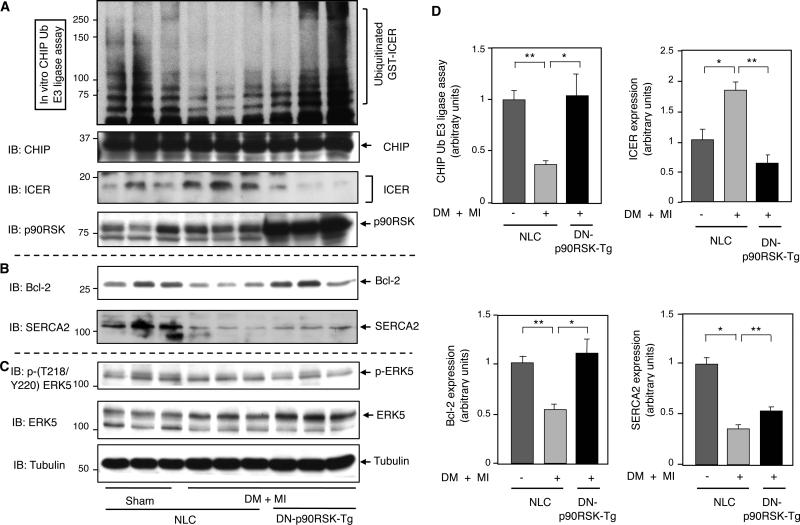
Figure 3. CHIP Ub ligase activity and ICER expression after MI in diabetic DN-p90RSK-Tg mice.
(A) Heart samples from sham control and DM+MI groups in NLC mice and DM+MI group in DN-p90RSK-Tg mice were collected and the CHIP Ub ligase activity assay was performed as described in the Methods (top). Western blots showing in (A) CHIP, ICER, and p90RSK, in (B) Bcl-2 and SERCA2, and in (C) p-(T218/Y220)ERK5, ERK5 and tubulin expression. (D) Quantifications of relative CHIP Ub ligase activity and ICER expression (upper) and the expression of Bcl-2 and SERCA2 (lower) (**p<0.01 *p< 0.05 compared to NLC sham operation control, mean±S.D., n=3,). Results are expressed as the relative ratio of mean value of NLC sham operation.

