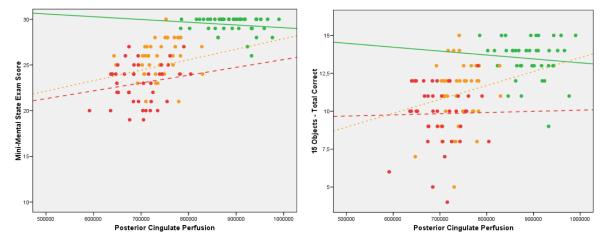
Figure 3.
Scatterplots of performance on the MMSE (left panel) and the 15-OT (right panel) as a function of the eigenvariate from the posterior cingulate gyrus region of interest. Each point represents a single subject in each group, and the lines represent the best-fit regression lines for each group.
The green lines represent the EC group, the orange the MCI, and the red AD.

