
Figure 2. Ipsilateral hemisphere two weeks postinjury.
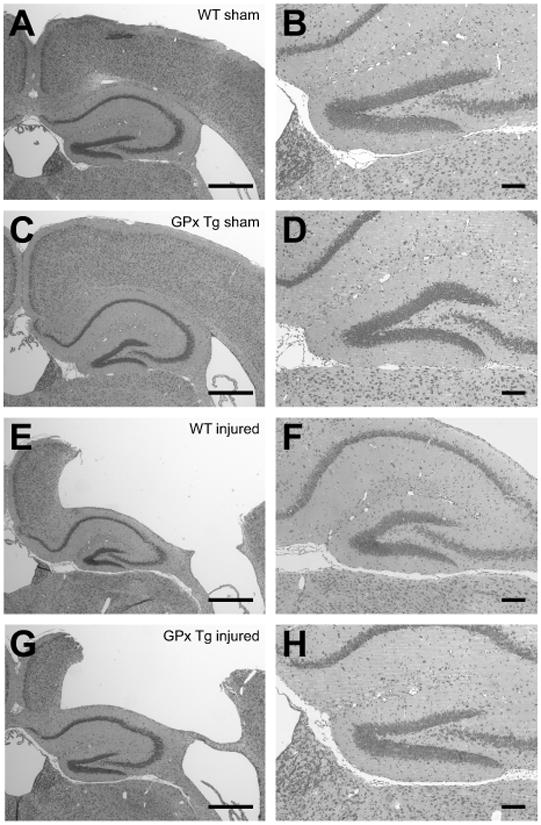
Nissl stains detail the gross pattern of injury from controlled cortical impact (E-H) compared to sham controls (A-D). TBI results in gross cortical tissue loss in both WT (E-F) and GPx Tg (G-H) animals with some mild deformation of the hippocampus. A-B, WT sham; C-D, GPx Tg sham; E-F, WT injured; G-H, GPx Tg injured. Scale bars: A, C, E, and G 500μm; B, D, F, and H 100μm.