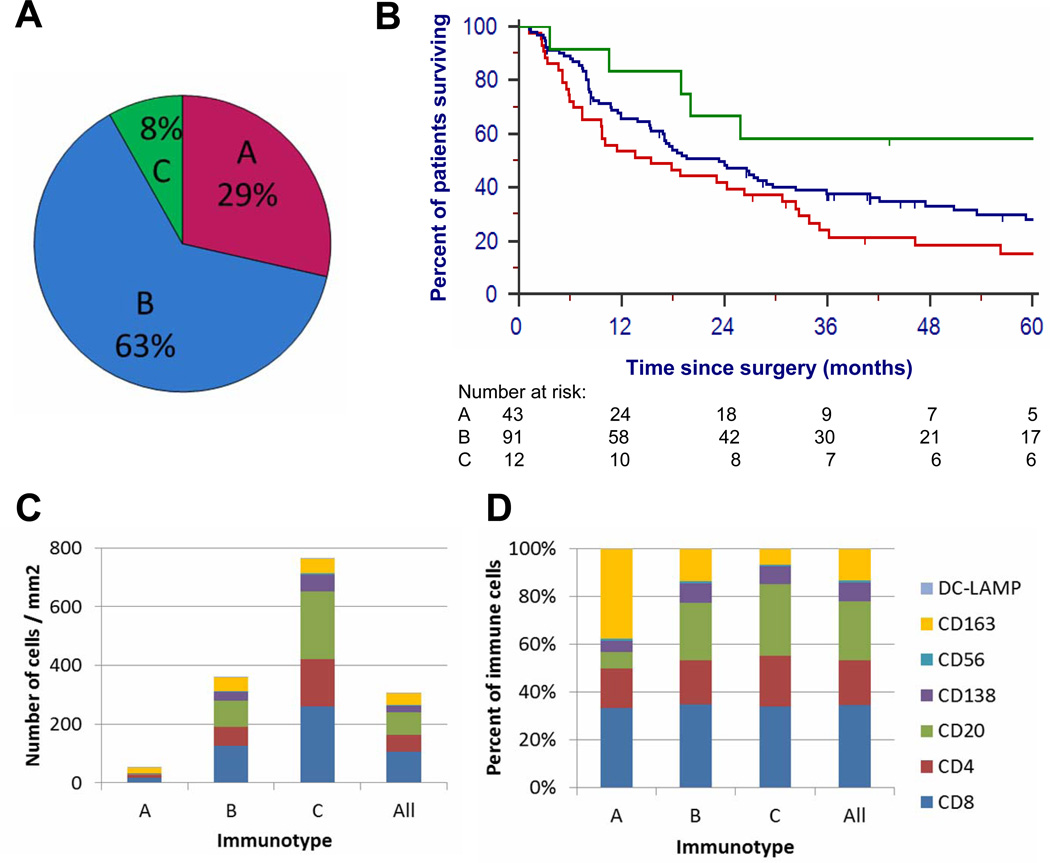
Figure 2. Immunotype frequency, prognosis, and cellular composition.
(A) The proportion of patients with each immunotype, in the first surgical specimen in the TMA, (B) Kaplan-Meier survival estimates for patients with each Immunotype, (C) Mean numbers of each immune cell subset, by Immunotype, and for all patients, (D) Proportion of mean total immune cells infiltrating tumor that are represented by each cell subset, by Immunotype.

