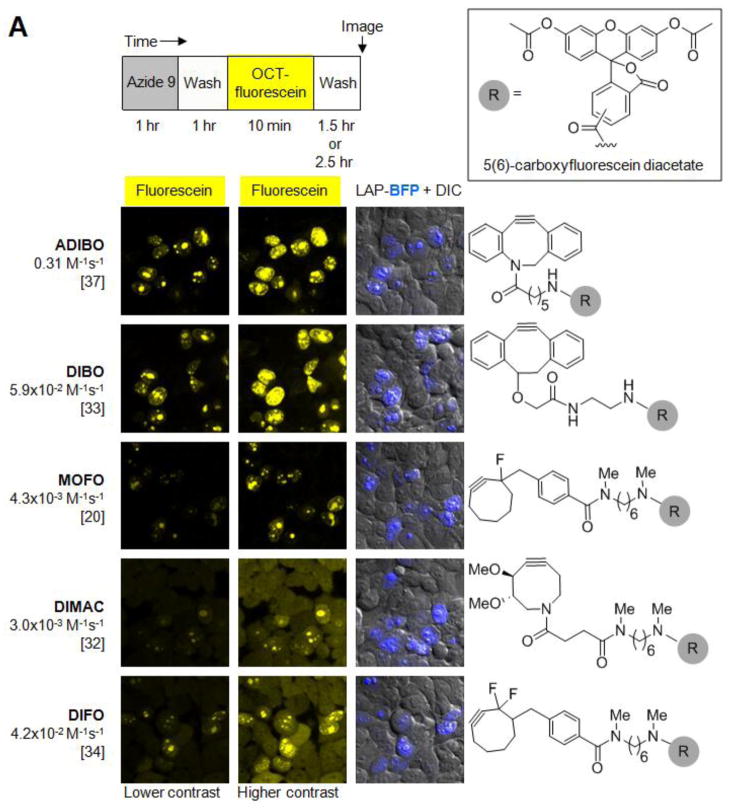
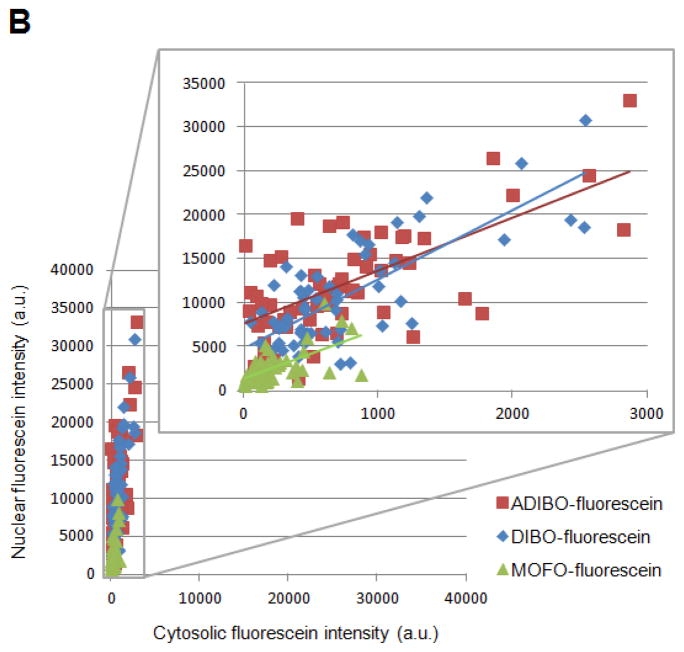
Figure 3.
Evaluation of various cyclooctyne structures for site-specific intracellular protein labeling. (A) Top: labeling protocol for HEK cells co-expressing W37ILplA and nuclear-localized LAP-BFP (LAP-BFP-NLS). After labeling with azide 9 for 1 hr and washing for 1 hr, cells were treated with the indicated cyclooctyne, conjugated to fluorescein diacetate (R, grey circle; structure shown in box), for 10 min. Cells were washed again for 2.5 hr to remove excess unconjugated fluorophore, except for the case of MOFO, in which cells required only 1.5 hr of washing. Bottom: images of labeled HEK cells. The LAP-BFP-NLS image is overlaid on the DIC image. Fluorescein signal intensity and specificity can be compared in the first two columns, which show the fluorescein images at lower contrast (left) and higher contrast (middle). Cyclooctyne structures are shown at right, and second-order rate constants (with reference below) are given on the left. ADIBO, aza-dibenzocyclooctyne;21,37 DIBO, 4-dibenzocyclooctynol;33,36 MOFO, monofluorinated cyclooctyne;20 DIMAC, 6,7-dimethoxyazacyclooct-4-yne;32 DIFO, difluorinated cyclooctyne.34 All scale bars, 10 μm. (B) Quantitation of data in (A). For the top three cyclooctynes (ADIBO, DIBO, and MOFO), the mean nuclear fluorescein intensity (representing specific labeling) was plotted against the mean cytosolic fluorescein intensity (representing non-specific labeling), for the same cell. >50 Single cells were plotted for each cyclooctyne.


