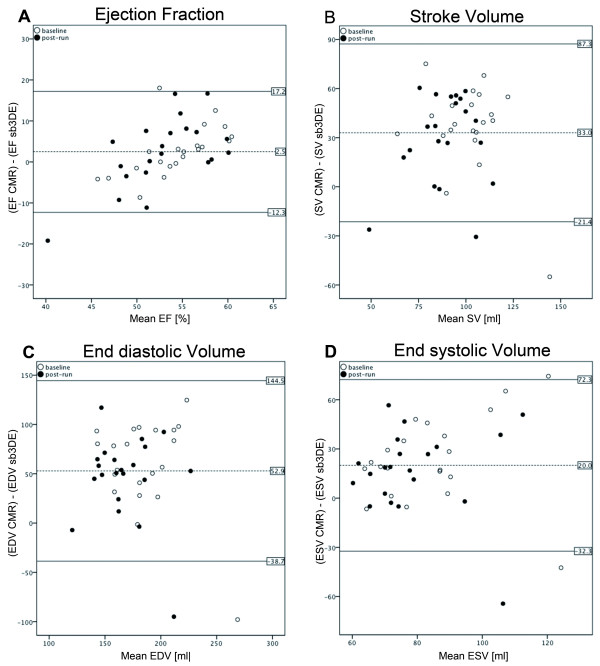
Figure 4.
Bland-Altman Plots for RV EF and dimensions comparing CMR and sb3DE. Results of a Bland-Altman analysis of CMR versus sb3DE, showing the extent of agreement in RV ejection fraction (A), stroke volume (B), end-diastolic (C) and end-systolic volume (D). In a Bland-Altman analysis the mean values of the two modalities are assigned to the x-axis and the difference between the two modalities to the y-axis. The upper and lower line represents two times the standard deviation

