
Figure 1.
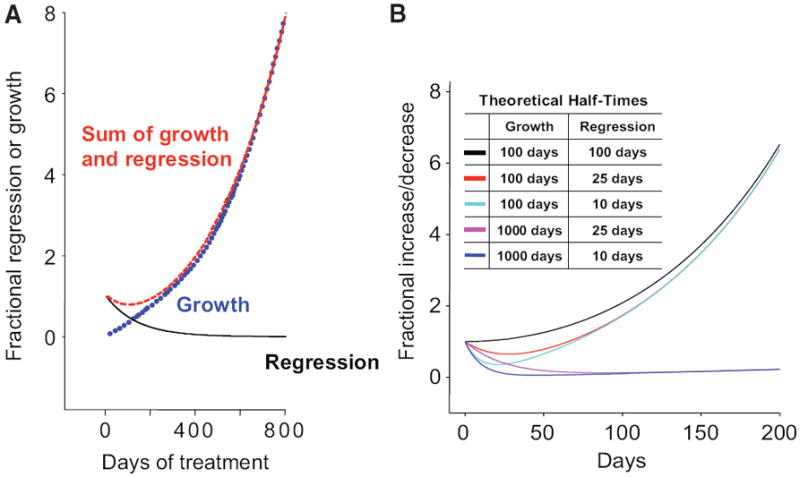
Theoretical plots for the regression/growth model. (A): The curve labeled “Regression” describes that fraction of the tumor that is regressing (decaying) during treatment. The curve depicted is the prediction of this equation with parameter g set to zero (i.e., regression only). The curve labeled “Growth” describes that fraction that grows continuously. The curve depicted is the prediction of this equation with parameter d set to zero (i.e., growth only). The curve labeled “Sum of Growth and Regression” gives the (net) sum of these two processes. The curve depicted is the prediction of the full regression/growth model of equation (1) in the text, with rate constant g set at 100 per day and d set at 10 per day. (B): The sums of concomitant regression and growth for several model tumors with varying regression rate (d) and growth rate (g) constants are depicted, showing that tumor measurements will vary depending on the extent of regression and growth that is occurring concurrently. Several curves are depicted for the “Sum of Growth and Regression.” These curves were generated using the theoretical half-times for growth and regression indicated in the box and demonstrate what the outcome will be for a tumor in which either growth or regression predominates even as the opposite effect is also occurring.