
Figure 2.
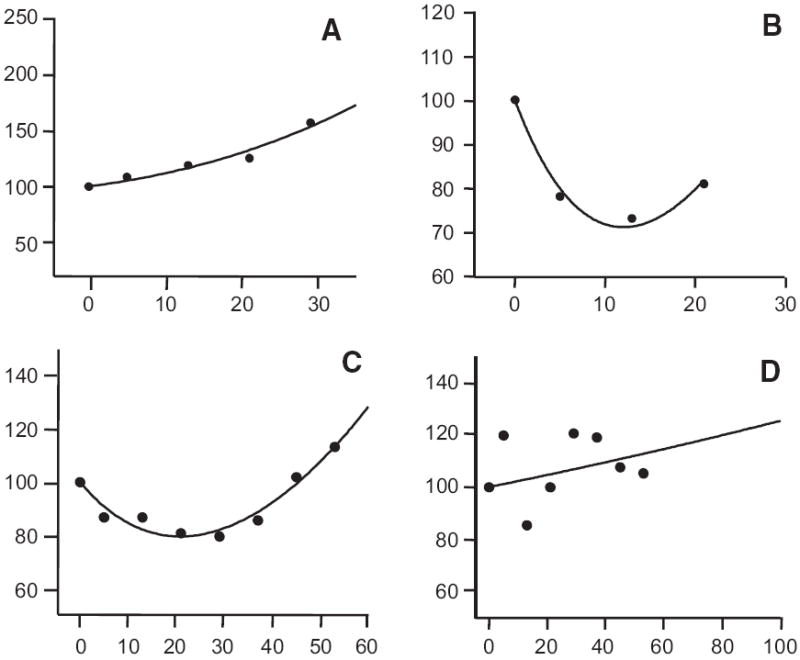
The sum of the perpendicular diameters (as a fraction of the value at the start of treatment assigned a value of one) against time in days for four patients of the 102 for whom sufficient data were available to attempt a full analysis (the full set can be found in online supplementary Figs. S1 and S2). The median number of data points was three per patient and the median time over which data were collected was 147 days. Initially the dataset from each patient was subjected to curve-fitting analysis. For 98 datasets, either g or d (or both) had an associated p < .05. (A) shows the pattern found in all but four of the patients randomized to the placebo arm that fit equation (3)—a pattern of growth either initially as shown in (A) or after a delay. For some of the patients randomized to receive bevacizumab, especially those randomized to the low-dose bevacizumab arm, a similar pattern was obtained. (B) and (C) depict the pattern found in the majority of patients randomized to the high-dose bevacizumab arm that fit equation (1)—regression followed by subsequent regrowth. (D) shows an example where the data showed much scatter and the model did not fit the observed data well—this was only observed in four of the 102 patients, two each from the low-dose and high-dose arms. The lines drawn are the best-fit theoretical predictions of the appropriate equations.