
Figure 4.
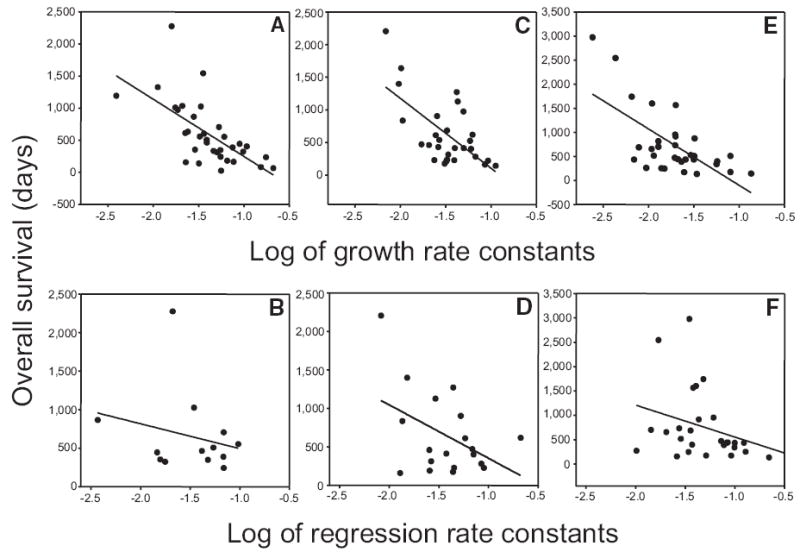
Dependence of patient survival (y-axis in days) on the log of the growth and regression rate constants for patients randomized to each of the three study arms (x-axis). All x-axes are logarithmic scales. Growth rate constants (g, per day) were derived using equation (1) or equation (3) and regression rate constants (d, per day) were derived using equation (1) or equation (2). Survival was strongly correlated (negatively, a higher growth rate being associated with a poorer survival) with the logarithm of the growth rate constant—(A): Pearson’s r = −0.648; p < .001; d.f. = 32; (C): Pearson’s r = −0.643; p = .002; d.f. = 27; (E): Pearson’s r = −0.657; p < .001; d.f. = 30—but not with the logarithm of the regression (decay) rate constant—(B): Pearson’s r = −0.236; p = 0.438; d.f. = 11; (D): Pearson’s r = −0.446; p = .055; d.f. = 17; (F): Pearson’s r = −0.321; p < .096; d.f. = 26. Note that for the correlation with the regression rate constant the curves, while not statistically significant, appear if anything negatively correlated, which is not what would be expected: a higher rate of tumor regression being associated here, if at all, with a poorer survival.