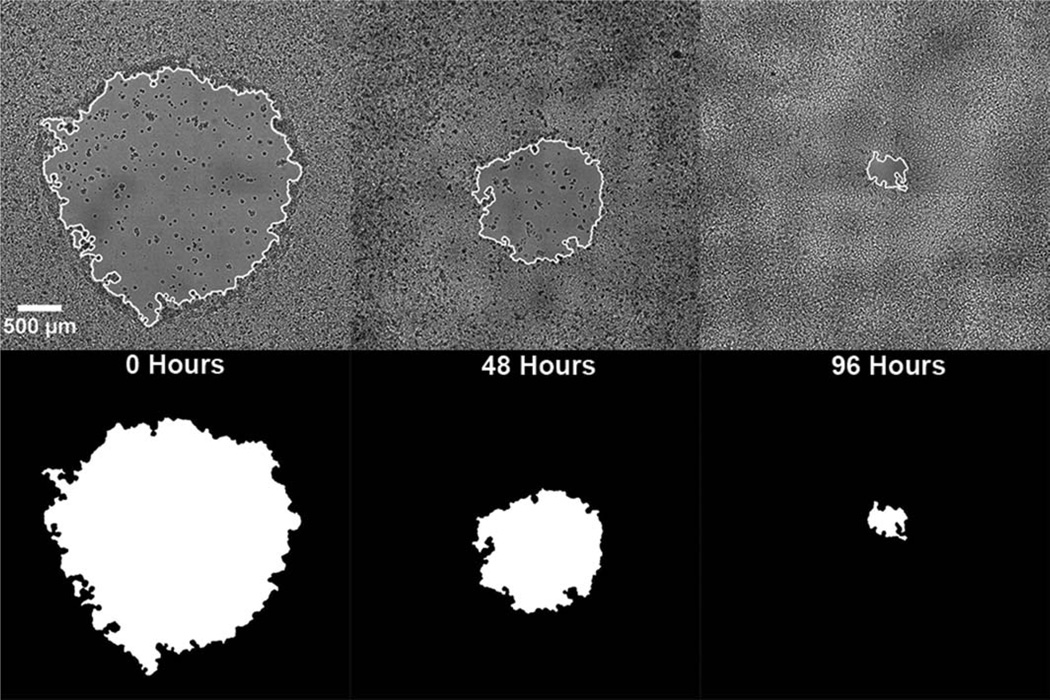
Figure 5.
Tracking wound healing of one sample over time. The top row consists of an outline of the wound mask superimposed on top of the initial bright field image at 0 (left), 48 (middle), and 96 h (right) after wound formation. The bottom row shows the binary wound mask of the same wound at 0 (left), 48 (middle), and 96 h (right) after wound formation.

