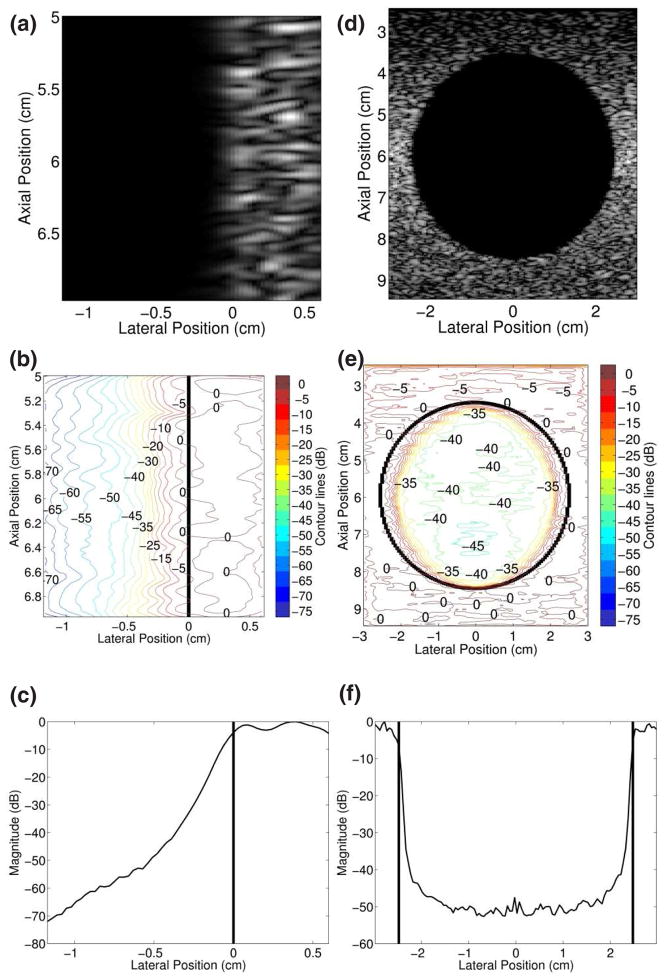
FIG. 3.
FIELD II simulated images of (a) a block and (d) a spherical void. The corresponding con tour plots (b and e) are referenced to the mean signal of the respective echogenic borders. The graphs of average signal magnitudes as a function of lateral position (c and f) are referenced to their respective maxima, and the vertical lines delineate echogenic borders. The values in (c) were obtained from averaging axial positions 5–7 cm and (f) shows the average of axial positions 5.5–6.5 cm.

