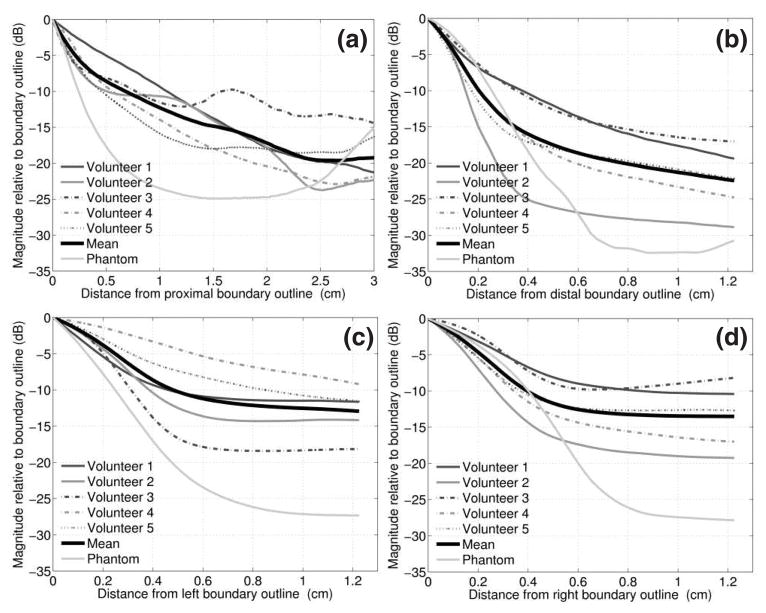
FIG. 9.
Clutter magnitude in harmonic images of the in vivo bladders and the bladder phantom as a function of distance from the (a) proximal, (b) distal, (c) left and (d) right out line bound aries. The mean of the five volunteers is shown in bold. The phantom data was extracted from the con tour plot data of figure 4(d).

