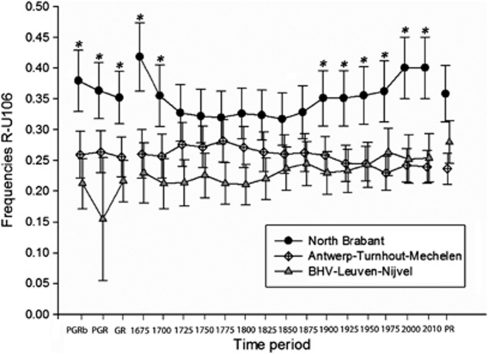
Figure 3.
Relative changes in frequency of R1b1b2a1 (R-U106) within the three main defined regions within Brabant during time. The error bars represent standard errors; an asterisk (*) represents a significant value between North Brabant and both Belgian regions. The abbreviations for particular time periods are similar to Figure 2.

