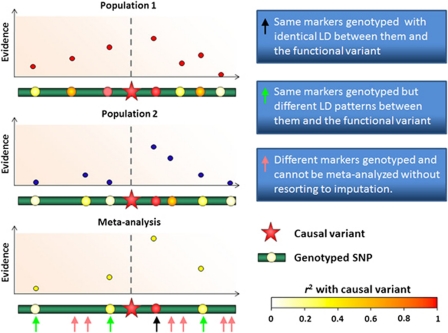
Figure 1.
Illustration of the three scenarios in a meta-analysis, where the genotyped SNPs may be in different degree of LD with the unobserved causal variant (star): (i) the ideal situation where the same SNPs are genotyped in two studies, and the LD between them and the functional variant is identical in both populations (black arrow); (ii) a realistic situation where the same markers are genotyped in two studies, but different LD patterns exist between them and the functional variant (green arrow); (iii) realistic situation where different markers are genotyped in two studies, and cannot be meta-analysed without resorting to imputation (pink arrow). The LD between the causal variant and each SNP is represented in different color intensity ranging from white (low LD) to red (high LD).

